

By Josh Hall
In the 1960s, Madeline Charnier started incubating eggs of the African Rainbow Agama (Agama agama) at different temperatures in her lab at the University of Dakar, Senegal. She noticed the sex ratio of the hatchlings was altered by the incubation temperature and in 1966 published the first report of temperature-dependent sex determination (henceforth “TSD”) in a vertebrate. This novel finding demonstrated that genetic sex determination (henceforth “GSD”) via chromosomes was not the only sex-determining mechanism in vertebrates. Subsequent study revealed that some fish and many reptiles have TSD including many lizards and turtles (but no snakes), the tuatara, and all crocodilians.
More than half a century has passed, and scientists across the globe are still working to understand the evolutionary and ecological importance of TSD as well as the molecular mechanisms that regulate this fascinating trait. In this article, I aim to summarize some of what we have learned about TSD over the past 50 years with a focus on aspects that should be interesting and useful to herpetoculturists. I will explain some important terminology which is necessary to understand the scientific literature and facilitate conversations among hobbyists, professionals, and scientists. I will then describe how a TSD pattern can vary across populations and individuals within a species. This is important to consider when selectively breeding. I will describe how fluctuating (vs constant) temperatures can alter a TSD pattern and how TSD patterns result from the combination of multiple factors. Ultimately, my goal is to make it easier for hobbyists and professional herpetoculturists to read and evaluate the scientific literature concerning TSD in reptiles.
Some important terms
First, we need to establish some basic definitions that come from the scientific literature. There are three currently recognized TSD patterns in reptiles (birds are technically reptiles, but when I say “reptiles” in this article, I am excluding birds).
- Pattern Ia TSD (also called MF for “Male-Female”) occurs when cool temperatures produce mostly males and warm temperatures produce mostly females.
- Pattern Ib TSD (also called FM for “Female-Male”) is the opposite of pattern Ia and cool temperatures produce females while warm temperatures produce males.
- Finally, pattern II TSD (also called FMF for “Female-Male-Female”) occurs when relatively cool and warm temperatures produce females but intermediate temperatures produce males.
Figure 1 shows an example of a FMF pattern using data from the landmark experiment that described the full TSD pattern in leopard geckos (Eublepharis macularius) (Viets et al. 1993). The authors incubated eggs at a range of constant temperatures and examined the sex ratios of hatchlings. I will refer to this figure to explain some of the remaining definitions. The y-axis at left shows the percentage of hatchings that are male. The x-axis on the bottom shows the incubation temperatures. The black circles show the sex ratios from the temperatures used in the study, and the solid black line that connects the circles can be considered an estimate of the entire TSD pattern.
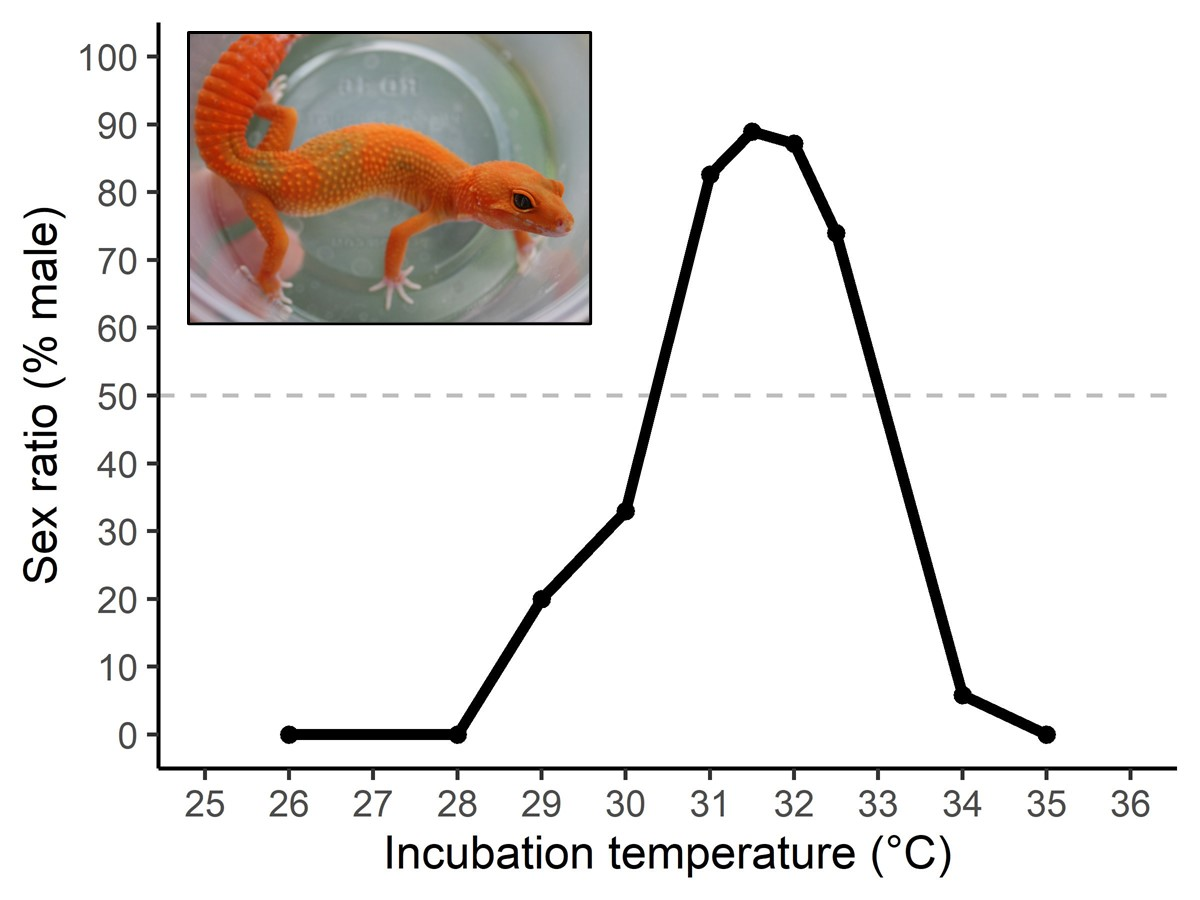
Figure 1. The FMF (type II) TSD pattern of leopard geckos (Eublepharis macularius). This figure was produced using data from Viets et al. 1993. The black circles show results from the incubation temperatures used in the study, the black line shows an estimate of the TSD pattern based on those data, and the horizontal gray line denotes a 50:50 sex ratio which can be used to define the pivitol temperatures.
The temperatures that produce males and females differ among species (and within species). As such, we have several terms that refer to incubation temperatures. Some temperatures are called female-producing temperatures (or male-producing temperatures). These terms describe incubation temperatures that produce 100% females (or 100% males). In Figure 1, incubation temperatures of 26 – 28 °C are female-producing temperatures. Note that 35 °C is also a female-producing temperature and that, in this study, no male-producing temperature was discovered (i.e. no one temperature produced 100% males). Indeed, many species that exhibit a FMF pattern have no male-producing temperatures. We may, however, refer to female-biased temperatures (or male-biased temperatures) which produce mostly (i.e. greater than 50%) females (or mostly males) but not 100%. In Figure 1, temperatures between 28 and 30 °C are examples of female-biased temperatures and those between about 31 and 33 °C are examples of male-biased temperatures. Note that there are additional female-biased temperatures above 33 °C because this is a FMF pattern. Finally, scientists often study and refer to pivotal temperatures (abbreviated “Tpiv”) which is the temperature that produces a balanced sex ratio (50% males and 50% females). In Figure 1, the gray broken line demonstrates a 50:50 sex ratio. The temperatures at which this line crosses the solid black line are the two Tpivs in this TSD pattern (~30.5 and 33.5 °C). Importantly, species with MF or FM TSD patterns will only have one Tpiv while those with a FMF, like leopard geckos, will have two Tpivs. The cooler Tpiv (30.5 °C) is the one that herpetoculturists usually think about because most eggs are incubated from 28-32 °C.
There are two final terms that do not describe a temperature in the TSD pattern but are very important. The thermosensitive period is the time during embryonic development when temperature is able to determine sex. This is often the middle third of development; however, there is a lot of variation across reptiles with respect to the length of the thermosensitive period and how advanced the embryos are at the time that eggs are laid (Figure 2). We will compare turtles, crocodilians, and lizards to illustrate. Most lizards complete the first third of development inside the oviducts of the mother (i.e. before egg-laying; Figure 2). Therefore, the thermosensitive period usually starts at or very close to the time of oviposition (i.e. egg-laying). Turtles and crocodilians, conversely, lay eggs when the embryo is at a very early developmental stage; therefore, the thermosensitive period for these groups does not start until several weeks after the eggs are laid. Therefore, to produce desired sex-ratios you must know both the TSD pattern and the thermosensitive period. Because temperature influences a diversity of traits in reptiles (e.g. coloration), many breeders take advantage of the thermosensitive period. For example, gecko breeders may incubate eggs at cooler temperatures initially to get females, but later move the eggs to a warmer incubator to brighten coloration.

Figure 2. The timing of egg-laying (black arrows) and the thermosensitive period (blue-shaded regions) for turtles, crocodilians, and lizards. For lizards, the thermosensitive period is shown for a skink (Bassiana duperreyi) and a gecko (Eublepharis macularius) to demonstrate variation within a major reptile group. The gray-shaded regions indicate the percent of development that occurs inside the female before eggs are laid. This figure is adapted from Shine et al. 2007.
Finally, you may see experimental studies refer to a split-clutch design. This is when researchers equally divide eggs from one clutch into different experimental treatments, like two temperature treatments. For a species that produces two eggs at a time, like most geckos, that would mean separating the two eggs from each clutch into the two treatments. This prevents confounding the effect of the treatment with maternal or genetic effects. As you will see in this article, the shape of the TSD pattern can differ among mating pairs for many reasons, so it is important to divide the eggs of each mating pair among treatments so that no one mating pair can heavily influence the results of a particular treatment.
The TSD pattern can vary among populations of the same species
Biologists focus much of their research attention on variation (i.e. differences among species, among populations, and among individuals). The overall TSD pattern (i.e. MF vs FM vs FMF) is consistent within a species, but the exact temperatures that produce male- or female-biased sex ratios can differ between populations. Figure 3 shows an example of how the TSD pattern might differ among two populations. In this experiment (Ewert et al. 2005), the researchers incubated common snapping turtle eggs (Chelydra serpentina) at various temperatures. The eggs came from six different populations across the species range in the USA. In Figure 3, the green line shows results for a population from Indiana and the pink line shows results from a population in Florida. Notice that the overall TSD pattern is consistent between the populations (FMF pattern), but the male- and female-biased temperatures and Tpivs differ significantly. These population-level differences in the TSD pattern probably represent local adaptation via natural selection, but the evolutionary and ecological importance of such differences is still under investigation.

Figure 3. Differences in the TSD pattern of two snapping turtle (Chelydra serpentina) populations. The green line shows results from a population in Indiana and the pink line shows results for a population in Florida. Data were adapted from Ewert et al. 2005.
The TSD pattern can vary among individuals within a population
The population-level differences in Figure 3 are intriguing, but they ultimately emerge from differences in the TSD pattern among individuals (i.e. among mating pairs). The TSD patterns shown in Figure 1 and Figure 3 result from incubating eggs from lots of male:female pairs at various temperatures and recording the resulting sex ratios. Importantly, these patterns represent the average TSD pattern across all of the mating pairs. Each mating pair, however, results in a unique combination of factors, including genes, which may influence TSD, creating slight differences in the TSD pattern among pairs. To illustrate, we will consider how the lower Tpiv of leopard geckos (~ 30.5 °C) might differ among mating pairs. Figure 4 shows results from an experiment that incubated eggs from several leopard gecko pairs at two temperatures: 29.5 and 31.5 °C. These data are based on a real study (Rhen et al. 2011), but I have simplified the data for the sake of explanation.
Figure 4 shows the sex ratios from 6 mating pairs. Eggs from each pair were divided among the two temperature treatments (i.e. a split-clutch design). Each line connects the results from a single pair (6 lines = 6 mating pairs), and 3 pairs are identified with the letters A, B, C to illustrate some important points. The thick blue line represents the average of all the lines. In this example, the average sex ratios across all mating pairs is 20% male for eggs incubated at 29.5 °C and 80% male for eggs incubated at 31.5 °C. Moreover, the average Tpiv for these geckos (where the blue line crosses the dotted gray line) is about 30.5 °C. Those averages are similar to what is expected from the overall TSD pattern shown in Figure 1. However, notice that there is some variation among mating pairs. For example, mating pair A produced male-biased results at both temperatures while mating pair C produced female-biased results at both temperatures. Mating pair B produced all females at 29.5 °C and all males at 31.5 °C. If we estimate a Tpiv (i.e. where the black line for a mating pair crosses the dotted gray line) for each mating pair, we would end up with some variation in Tpivs. The Tpiv for pair A would be lower than 29.5 °C. The Tpiv for pair C would be greater than 31.5 °C. The Tpiv for pair B would be about 30.5 which is the average Tpiv for all pairs. You can also see that the other lines don’t always cross the dotted line at exactly 30.5 °C.

Figure 4. Results of an incubation experiment with six mating pairs of leopard geckos (adapted from Rhen et al. 2011). The black dots show the sex ratios from each breeding pair at both 29.5 and 31.5 °C. The lines connecting the dots can be used to estimate a pivotal temperature (i.e. where the black lines cross the gray dotted line). The heavy blue line shows the average slope of all six lines from the breeding pairs. Letters A, B, and C are references for discussion in the text.
Let’s imagine that we collected data from 10,000 male:female pairs of leopard geckos. We then could estimate a Tpiv for all 10,000 pairs and plot the percentage of Tpivs across temperatures. Figure 5 shows what such a graph might look like (this is hypothetical and not from a real study). The x-axis on the bottom shows all the potential Tpivs from the mating pairs. The y-axis at left shows the percentage of the mating pairs that have each Tpiv. Note that I have placed the Tpivs of pairs A, B, and C from Figure 4 on this graph. For now, ignore the area at right that is shaded in dark gray. I will explain that later. This graph is what we call a normal distribution or sometimes a “bell curve”. It shows that most mating pairs would have a Tpiv very close to the average Tpiv of 30.5 °C (like pair B). However, some mating pairs will have a Tpiv that is below or above the average like pairs A and C. A small percentage of mating pairs will have a Tpiv that is far away from the average. The purpose of this graph is to demonstrate that the TSD pattern is like many biological traits – there is variation among individuals. You could measure other traits in leopard geckos, like tail length, and plot a similar graph. Most geckos would have a tail length that is close to the average but some geckos would have tails that are much shorter or much longer than average. Due to variation among individuals in the TSD pattern, it is important to remember that some breeding pairs will produce sex ratios that differ from what is expected based on information reported in care guides and books.

Figure 5. A hypothetical normal distribution of pivotal temperatures for leopard geckos. The vertical dotted lines (A, B, C) correspond to estimated pivotal temperatures of breeding pairs from Figure 4.
Selective breeding can potentially influence the TSD pattern
Scientists have only recently started to rigorously study the mechanisms that cause variation in the TSD pattern among individuals. We do know, however, that some of this variation results from genetic differences among mating pairs (Rhen et al 2011). Such genetic variation may explain how TSD patterns evolve, and this is an exciting avenue of current research. Regardless, the genetic underpinnings of TSD should force us to consider potential unintended consequences of selective breeding. Imagine, for example, that by chance you only have mating pairs in your collection that have Tpivs above 31.5 °C (illustrated by the dark gray shading in Figure 5). This may not be very likely but it is possible, especially if you only have a few pairs in your collection. If you breed those pairs and incubate eggs at 31 °C, you would get mostly females even though you would expect to get mostly males at that temperature based on the overall TSD pattern (shown in Figure 1). Perhaps you conduct several generations of line-breeding (i.e. breeding only your collection to itself – no outcrossing) to try and enhance a particular trait (e.g. body color). Your entire collection might have an unusually high Tpiv which could make it difficult to produce desired sex ratios.
Herpetoculturists have long been familiar with potential problems that result from line-breeding and extensive inbreeding (e.g. short tails, underbites, odd behaviors), but we should remember that TSD is an important trait that may also be altered by inbreeding. Therefore, occasional outcrossing will not only reduce the chances of morphological abnormalities, it will ensure that desirable sex ratios are always attainable. Many species probably exhibit a lot of genetic variation in captivity due to collection at multiple times and from multiple points across their native range. For such species, it isn’t likely that selective breeding will drastically alter the TSD pattern in some harmful way. However, for captive populations that originate from a few individuals collected in a single or few localities, this could be a problem. The East Indian Leopard Gecko (Eublepharis hardwickii) may be an example because many breeders have trouble producing males in this species. No study has formally characterized their TSD pattern; however, my suspicion is that some breeding pairs/colonies have unusually high Tpivs (i.e. the dark shaded region in Figure 5). This makes sense given that some breeders report difficulty producing males but others have no trouble at all. As such, increasing the genetic diversity of breeding colonies may be the solution. Another option would be to experiment with fluctuating temperatures (see below); however, if the true cause is genetic, fluctuating incubation temperatures will only treat the symptom and not the cause.
The TSD pattern can be influenced by fluctuating temperatures
Most herpetoculturists incubate eggs at constant temperatures. For decades, this was true of scientists conducting TSD research as well. Indeed, TSD patterns, like those in Figures 1 and 3, are typically characterized using constant temperatures. However, in the wild, nest temperatures often fluctuate. As the sun rises and falls each day, nest temperatures rise and fall, too. Moreover, most eggs take many weeks or months to incubate, and nest temperatures can change dramatically over this time period due to weekly and monthly changes in weather. Over the last three decades, scientists have been trying to understand how such temperature changes influence all kinds of traits in reptiles, including sex-ratios. One simple example of how daily fluctuations in temperature can alter sex-ratios comes from the painted turtle (Chrysemys picta), which has been used extensively in TSD research. This species has a MF pattern with a Tpiv of about 28 °C. Figure 6 shows the sex-ratios that result from incubating eggs at a constant 28.5 °C (solid gray line) and a treatment that fluctuates around 28.5 °C by 3°C on a daily basis (solid black line). Even though the fluctuating treatment had a mean temperature of 28.5 °C, which is close to the Tpiv and the same as the constant temperature treatment, this resulted in 100% females (Les et al. 2007) vs 55% females in the constant temperature treatment.

Figure 6. Results from incubating painted turtle (Chrysemys picta) eggs at constant (solid gray line) and fluctuating (solid black line) incubation temperatures. The fluctuating temperature was repeated every day during incubation. The mean temperature of the fluctuating treatment was identical to the constant temperature treatment: 28.5 °C. Data were taken from Les et al. 2007.
Why did the fluctuating treatment produce all females when the average temperature was 28.5 °C, which is close to the Tpiv? To understand this, you have to think about embryos with respect to two different clocks. One clock is the one you might wear on your wrist (i.e. time measured in seconds, minutes, and hours). According to that clock, the eggs in the fluctuating treatment spent the same amount of time at temperatures below 28.5 °C as they spent at temperatures above 28.5 °C. That might lead you to think that the average temperature during development was 28.5 °C. The other clock, which is a bit metaphorical, is the developmental clock. This is not measured in minutes and hours but rather by how much development occurs in a unit time. This clock is heavily influenced by temperature: it runs faster at warmer temperatures and slower at cooler temperatures because the chemical reactions that regulate development speed up and slow down with temperature. Therefore, even though the clock on your wrist says that the eggs spent the same amount of time at temperatures warmer than 28.5 °C (i.e. female-producing temperatures) as cooler than 28.5 °C (i.e. male-producing temperatures), the embryo actually spent a greater portion of development at temperatures above 28.5 °C, because development proceeds at a faster rate at warmer temperatures. That means that when temperatures fluctuate, the sex ratios will not be predicted by the average temperature of the fluctuation (in this example, 28.5 °C) but will be more similar to sex-ratios produced by warmer constant temperatures. Indeed, a constant 30 °C usually results in 100% females for C. picta. For this reason, scientists have developed statistical models that can be used to convert fluctuating temperatures, like those measured from nests in the wild, to what we call “constant temperature equivalents” (abbreviated as CTEs). These models attempt to reconcile the way that TSD patterns are characterized (i.e. by using constant incubation temperatures in the lab) with how nest temperatures fluctuate in the wild.
The TSD pattern may result from a combination of several factors
The final point I wish to illustrate is that TSD isn’t always simple or easy to describe because factors other than temperature can influence the TSD pattern. Bearded dragons (Pogona vitticeps) are a fine example of how TSD can be rather complicated. A few relatively recent studies have demonstrated that bearded dragons have both GSD and TSD. Like birds and many other reptiles, they have ZW/ZZ sex chromosomes and the heterogametic sex (i.e. the sex with different chromosomes – ZW) is female while the homogametic sex (ZZ) is male. This differs from mammals which have XY/XX chromosomes and the heterogametic sex (XY) is male. Figure 7 illustrates how sex-determination works for bearded dragons. An embryo with ZW chromosomes will always be female regardless of incubation temperature (shown on the right side of Figure 7). An embryo with ZZ chromosomes, however, will be male at most all incubation temperatures but will be female at really hot temperatures (shown on the left side of Figure 7). These females are called “sex-reversed” females, and they are found both in captive and wild populations. If a ZZ male mates with a typical ZW female, then the offspring can have ZZ or ZW chromosomes and sex-determination will follow typical GSD across most incubation temperatures: ZW will be female and ZZ will be male. This would cause anyone to assume they don’t have TSD so long as they didn’t incubate at really high temperatures. If, however, a ZZ male and a ZZ female (i.e. “sex-reversed” female) mate (as shown bottom left), all offspring will have ZZ chromosomes. Offspring sex ratios will follow a classic MF TSD pattern with a Tpiv = ~ 33 °C. Importantly, researchers found that “sex-reversed’ females were capable of producing viable eggs, and their offspring had no noticeable signs of abnormalities. Bearded dragons are now being used as a model species to help scientists understand how TSD evolves (Holleley et al. 2015).
Another species for which sex is determined both by chromosomes and temperature is the Australian three-lined skink (Bassiana duperreyi). This species is not commonly kept and bred in captivity but has been used extensively in research. In this species, sex is typically determined by an XX/XY chromosome system. In 2002, researchers discovered that the sex chromosome system could be overidden by incubating eggs at relatively cool, fluctuating temperatures (Shine et al. 2002). These researchers mimicked fluctuations that characterize nests in the wild and found that fluctuating treatments with cooler mean temperatures resulted in a much greater percentage of males than expected. Intriguingly, regardless of temperature, larger eggs were more likely to be female and smaller eggs were more likely to be male, so the size of the egg at oviposition also partly determines sex!

Figure 7. A diagram of how TSD and GSD work in bearded dragons. Embryos with ZW chromosomes are always female and those with ZZ are male across most temperatures. At temperatures greater than 32 °C; however, ZZ embryos will be female. If a ZZ male and ZZ female mate, their offspring will exhibit a classic MF TSD pattern.
Finally, much research demonstrates that yolk steroids, like estrogen, can influence offspring sex. Females may differ in how they allocate these steroids to egg yolk, and this can further influence how TSD patterns differ among mating pairs. This is called a “maternal effect”. Considering both maternal and genetic effects is probably necessary to understand why a TSD pattern varies across populations and between individual mating pairs. These are just a few examples of how TSD patterns are not always simple to describe, but many other examples have been discovered and certainly more are yet to be found.
Some final thoughts
Hopefully, I’ve presented a clear explanation of some of the important factors related to TSD in reptiles. From these concepts, I think some practical advice emerges for breeders who work with species that exhibit TSD.
- Be sure to outcross and maintain genetic diversity – not just to prevent morphological and behavioral abnormalities but because TSD likely has a genetic basis. This is particularly important if you are having trouble producing desired sex ratios or work with a species that is relatively rare in captivity.
- Keep careful records of sex ratios for each mating pair and use a split-clutch design when possible. This is the only way to determine if any individuals in your breeding colony consistently produce unusual sex ratios. Such individuals should probably not be bred for the same reasons that you wouldn’t breed individuals with other types of abnormalities.
- Be cautious (and forgiving) when purchasing or advertising “temp-sexed” individuals. This is a general rule people follow, but hopefully knowing that the TSD pattern can vary among populations and mating pairs further emphasizes this point. Moreover, Tpivs have been shown to change slightly through a breeding season and as males/females age. I didn’t have space to explain that, but it should further emphasize that there are many factors that influence the TSD pattern.
- Rely on the scientific literature to understand TSD. Herpetoculturists have provided the world with excellent information about the captive husbandry and breeding of all sorts of species, but unless a species’ TSD pattern has been subjected to scientific investigation, it isn’t wise to make assumptions based on limited data. Crested geckos (Correlophus ciliatus) are a fine example. Early reports indicated these geckos have TSD, but we now know they actually have a ZZ/ZW sex chromosome system.
- Be sure to read the scientific literature! Use scholar.google.com to find original research articles about TSD in the species that you keep and breed. Sometimes, you won’t be able to access the articles if you don’t have a subscription to the journal. You can usually still get the article in one of two ways. First, most scientists have a personal website where they make pdfs of their papers available for download. Second, try sending an email to the corresponding author (their contact information is nearly-always available). Most likely, they will be thrilled to send you a copy of their manuscript, and many will even be happy to answer questions for you.
References
Ewert, M. A., Lang, J. W., & Nelson, C. E. (2005). Geographic variation in the pattern of temperature‐dependent sex determination in the American snapping turtle (Chelydra serpentina). Journal of Zoology, 265(1), 81-95.
Holleley, C. E., O’Meally, D., Sarre, S. D., Graves, J. A. M., Ezaz, T., Matsubara, K., … & Georges, A. (2015). Sex reversal triggers the rapid transition from genetic to temperature-dependent sex. Nature, 523(7558), 79-82.
Les, H. L., Paitz, R. T., & Bowden, R. M. (2007). Experimental test of the effects of fluctuating incubation temperatures on hatchling phenotype. Journal of Experimental Zoology Part A: Ecological Genetics and Physiology, 307(5), 274-280.
Rhen, T., Schroeder, A., Sakata, J. T., Huang, V., & Crews, D. (2011). Segregating variation for temperature-dependent sex determination in a lizard. Heredity, 106(4), 649-660.
Shine, R., Elphick, M. J., & Donnellan, S. (2002). Co‐occurrence of multiple, supposedly incompatible modes of sex determination in a lizard population. Ecology Letters, 5(4), 486-489.
Shine, R., Warner, D. A., & Radder, R. (2007). Windows of embryonic sexual lability in two lizard species with environmental sex determination. Ecology, 88(7), 1781-1788.
Viets, B. E., Tousignant, A., Ewert, M. A., Nelson, C. E., & Crews, D. (1993). Temperature‐dependent sex determination in the leopard gecko, Eublepharis macularius. Journal of Experimental Zoology, 265(6), 679-683.


")